| PROJECT OVERVIEW |  |
| PUBLICATIONS | |
| PROTOTYPES | |
| EVALUATION | |
| PEOPLE | |
| EVENTS | |
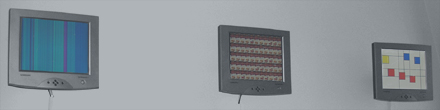
This visualization was featured as a part of the Emerging Technologies Exhibition at SIGGRAPH 2001 (more info about the exhibition here)
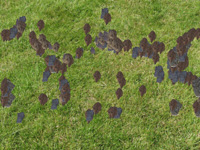
The visualization presents a recent history of earthquake activity from around the world. For every earthquake (with a magnitude greater than 4 on the Richter scale) that has occurred during the last month, a rock is placed on the grass background in the visualization. The size of the rock represents the magnitude of the earthquake and the placement is determined by the earthquake's location on a world map. In this way, patterns of stones reveals seismic hotspots such as the American west coast, Iceland and the Mediterranean. The information is updated every 60 seconds to reflect any recent earthquakes dynamically.
The data for the visualization is retrieved from online earthquake logs provided by the Icorporated Research Institutions for Seismology (IRIS)
The visualization is featured in the paper Informative Art: Information Visualization for Everyday Environments, presented at GRAPHITE 2003, in Melbourne, Australia.
 |
Bus Composition |
|
Weather Composition |
|
Forecast Composition |
|
E-mail Composition |
|
Motion Painting |
|
Stone Garden |
|
Objective/Subjective Time |
|
Campbell Clock |
|
Activity Wallpaper |