| PROJECT OVERVIEW |  |
| PUBLICATIONS | |
| PROTOTYPES | |
| EVALUATION | |
| PEOPLE | |
| EVENTS | |
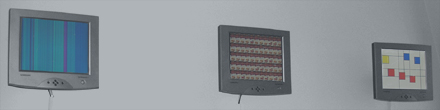
This visualization is a modified version of the Weather Composition that was designed for the IT-University in Göteborg, Sweden.

The visualization shows the current weather and a four-day forecast for the Göteborg region. Each square represents the weather for one day and the top row shows the current weather condition (left) and the forecast for the next day (right). The bottom row shows, from left to right, the following three days.
The weather information is mapped to the squares in the same way as in the Weather Composition, i.e., size reflects temperature and color reflects weather conditions (yellow is sunny, red is cloudy and blue is precipitation). The weather data is collected from the Yahoo! weather service every 60 seconds, in order to reflect any changes in the current weather.
The Weather Composition is featured as a design example in the book chapter From Usable to Enjoyable Information Displays, which can be found in the book Funology - From Usability to Enjoyment, available from Springer Online.
 |
Bus Composition |
|
Weather Composition |
|
Forecast Composition |
|
E-mail Composition |
|
Motion Painting |
|
Stone Garden |
|
Objective/Subjective Time |
|
Campbell Clock |
|
Activity Wallpaper |