| PROJECT OVERVIEW |  |
| PUBLICATIONS | |
| PROTOTYPES | |
| EVALUATION | |
| PEOPLE | |
| EVENTS | |
The weather composition was designed for the Emerging Technologies exhibition at SIGGRAPH 2001.
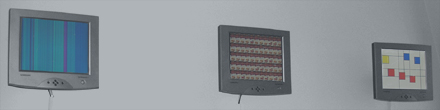
The visualization displays weather information for six cities in the world. Each colored square represents on city, and the squares are laid out loosely based on a world map. In the upper row, from left to right, the squares represent Los Angeles, CA, USA; Göteborg, Sweden and Tokyo, Japan. The ones in the bottom row are Rio de Janeiro, Brazil; Cape Town, South Africa and Sydney, Australia.
The size of a square represent the current temperature in that city, so the bigger the square is, the hotter it is, and vice versa. The colors represent the current weather conditions, where yellow means sunny, red means cloudy and blue means precipitation. In the screenshot above, taken in the summer of 2001, you can see that Los Angeles, Rio and Cape Town all are hot, but have different conditions (i.e. rainy, cloudy and sunny, respectively).
The weather data is collected from the Yahoo! weather service every 60 seconds, in order to reflect any changes in the weather dynamically.
The Weather Composition is featured as a design example in the paper Informative Art: Information Visualization for Everyday Environments, which was presented at the GRAPHITE Conference 2003
 |
Bus Composition |
|
Weather Composition |
|
Forecast Composition |
|
E-mail Composition |
|
Motion Painting |
|
Stone Garden |
|
Objective/Subjective Time |
|
Campbell Clock |
|
Activity Wallpaper |